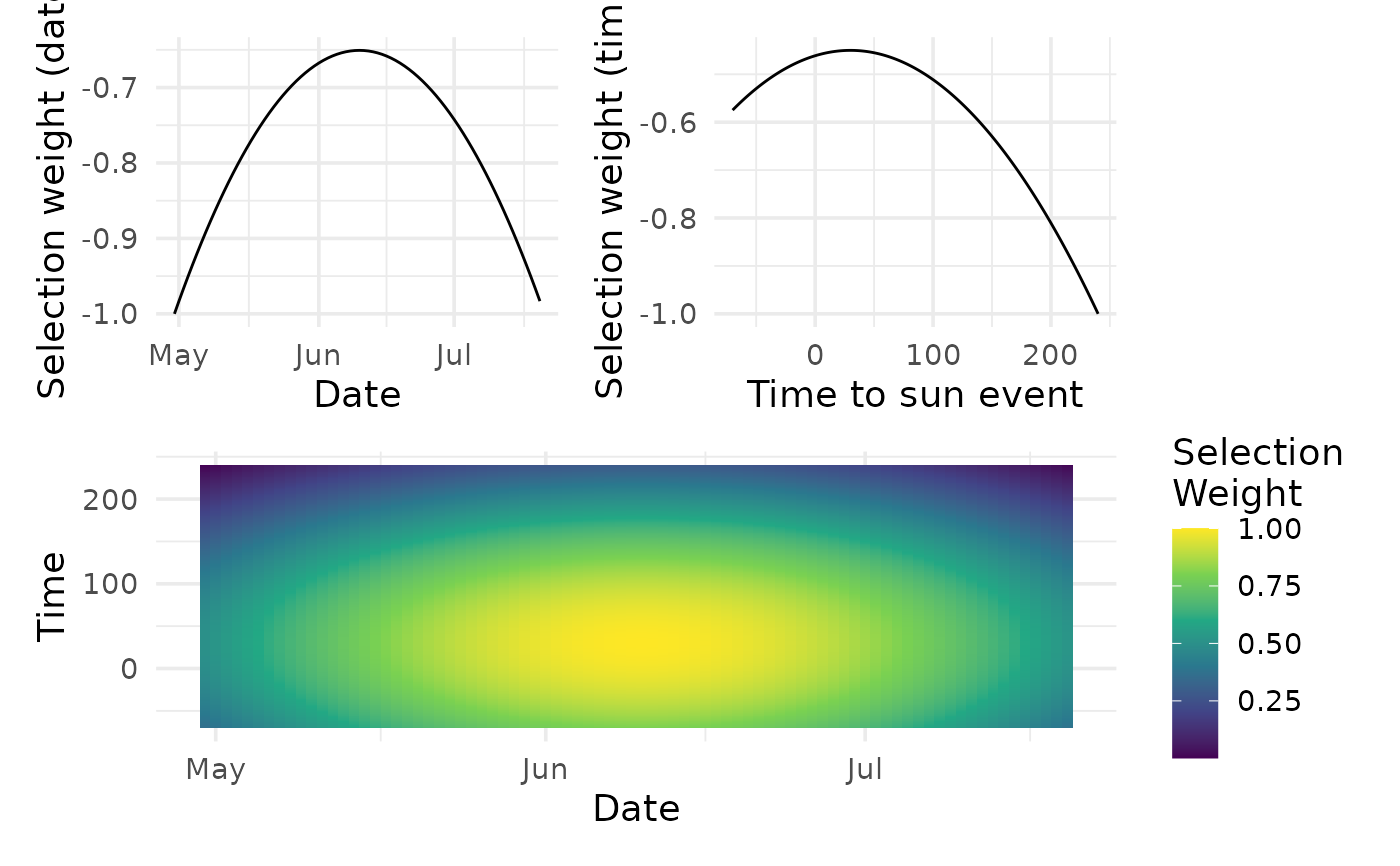
This function creates and explores parameters for generating selections.
These parameters define the selection distribution of minutes (min) around
the sun event (sunrise/sunset), as well as of days (day).
Arguments
- min_range
Numeric vector. Range of the sampling distribution of minutes around the sun event.
- min_mean
Numeric. Mean of the sampling distribution of minutes to the sun event.
- min_sd
Numeric. SD in minutes of the sampling distribution of minutes around the sun event.
- day_range
Date/Datetime/Numeric vector. Range of sampling distribution of days. Can be Dates, Date-times, or DOY (day-of-year, 1-366).
- day_mean
Date/Datetime/Numeric. Mean date of the sampling distribution of days. Can be Date, Date-time, or DOY (day-of-year, 1-366).
- day_sd
Numeric. SD in days of the sampling distribution of days.
- offset
Numeric. Offset to shift for time of day in minutes.
- return_log
Logical. Log the density in the selection function?
- selection_fun
Character. Selection function to use. Options are
lognorm,norm(default), orcauchy.- selection_var
Character. Selection variable to plot (if
plot = TRUE). Options are arepsel,psel_doy,psel_min,psel_std,psel_scaled, orpsel_normalized(default).- return_params
Logical. Return parameter list for use in calc_selection_weights()?
- plot
Logical. Create plot of simulated selection weights? If
return_param = TRUEandplot = TRUEplot is created as a side effect. Other wise, plot is returned directly.